The Stamped blog
How to Measure BFCM Performance: Key Retention Metrics for Q1 Planning
The truth is, BFCM isn't about how much you sold between Thursday and Monday. It's about whether those customers will still be with you in January, February, and March.
Uncategorized
by Aiden Brady

Introduction
Black Friday and Cyber Monday are over. Your revenue dashboards are final. You hit (or missed) your targets. Now what?
If you’re like most ecommerce brands, you’re already looking ahead to Q1: planning inventory, outlining campaigns, setting goals. But what if you’re measuring BFCM success all wrong?
Most brands obsess over weekend revenue numbers while completely missing the metrics that actually predict Q1 performance. The truth is, BFCM isn’t about how much you sold between Thursday and Monday. It’s about whether those customers will still be with you in January, February, and March.
The Real BFCM Report Card Comes Later
Here’s what separates brands that thrive in Q1 from those that struggle: they understand that BFCM performance isn’t measured on November 29th. It’s measured 30-60 days later.
Why? Because the customers you acquired during the holiday weekend are making critical decisions right now about whether they’ll ever buy from you again. Some are already becoming loyal repeat customers. Others are drifting away, never to return. The difference between these outcomes often comes down to what you do (or don’t do) in this critical window.
Think of it this way: BFCM revenue is your initial investment. Retention is your return. And just like any investment, you can’t assess the return until enough time has passed to see the results.
Why Most Brands Get This Wrong
The problem starts with how we’re conditioned to think about holiday performance. When December rolls around, leadership wants to see:
- Total revenue
- Number of orders
- Average order value
- New customer acquisition costs
These metrics aren’t useless—they tell you if you ran a profitable promotion. But they don’t tell you if you built a sustainable business. They don’t reveal whether you acquired customers worth acquiring, or whether you’re set up for Q1 success.
This blind spot is expensive. Brands pour resources into acquiring BFCM customers, then watch passively as over 80% of them never make a second purchase. They don’t realize they’re hemorrhaging potential revenue until Q1 numbers come in soft, and by then it’s too late to course-correct.
The Metrics That Actually Matter
So what should you be measuring instead? The retention metrics that predict Q1 performance fall into five critical categories:
1. Behavioral Activation Metrics
The first 30-45 days after BFCM tell you everything about whether customers will stick around. Are they opening your emails? Engaging with your loyalty program? Responding to win-back attempts? These early indicators reveal which customers are genuinely interested versus those who were just chasing a deal.
Customer engagement patterns are set early. If someone doesn’t engage with your brand within the first month, they’re unlikely to suddenly become an active customer in month two or three.
2. Second Purchase Velocity
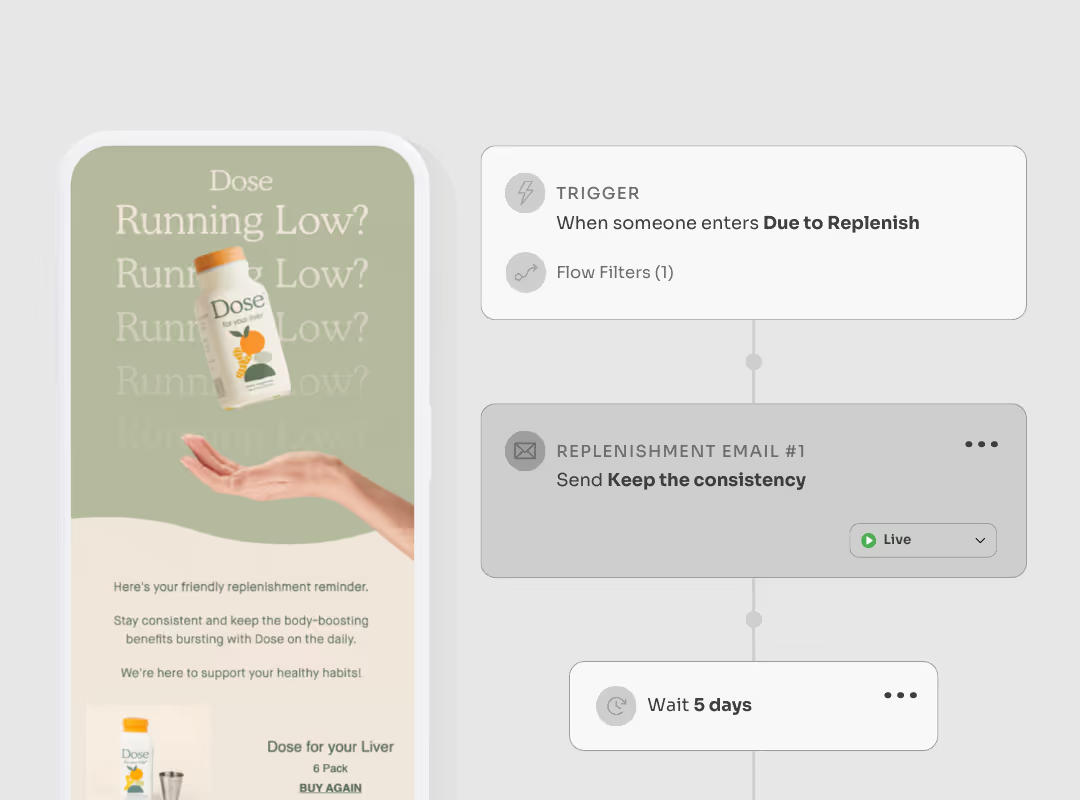
Time-to-second-purchase is one of the most predictive metrics for lifetime value, yet most brands don’t track it systematically. Customers who make their second purchase within 30-45 days have dramatically higher LTV than those who wait 60+ days. Why? Because quick second purchases signal genuine product satisfaction and intent to build a relationship with your brand, not just capitalize on a discount.
3. Review and Social Proof Generation
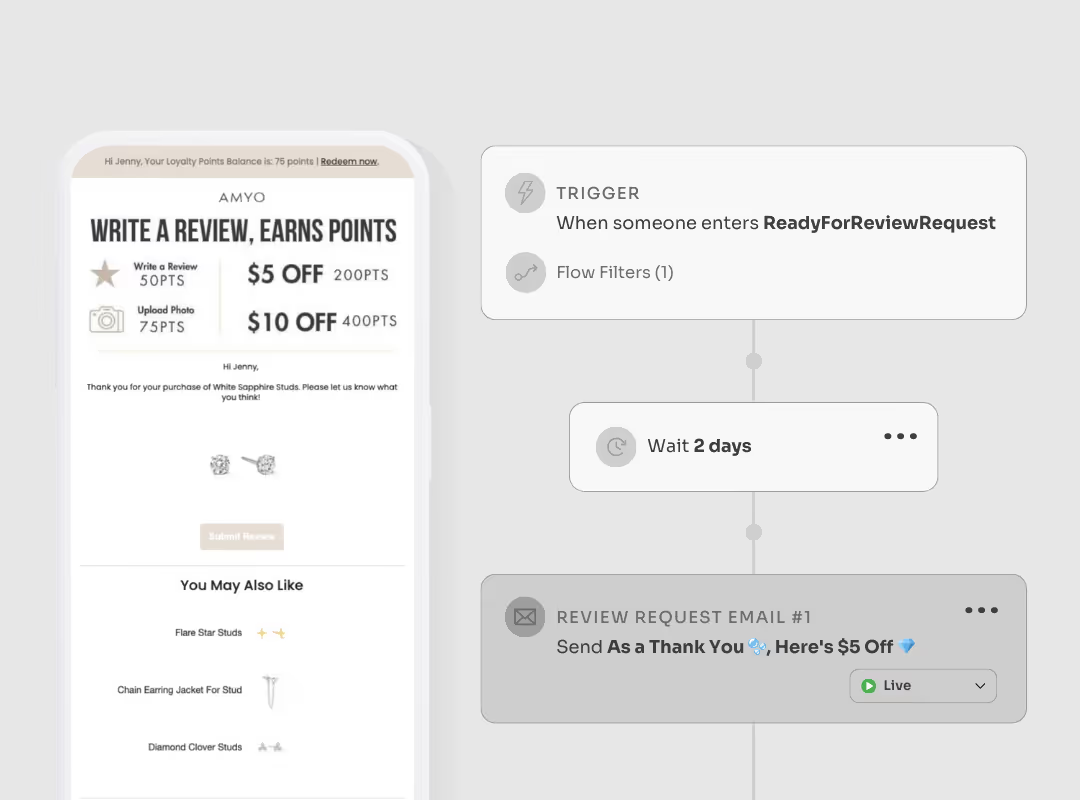
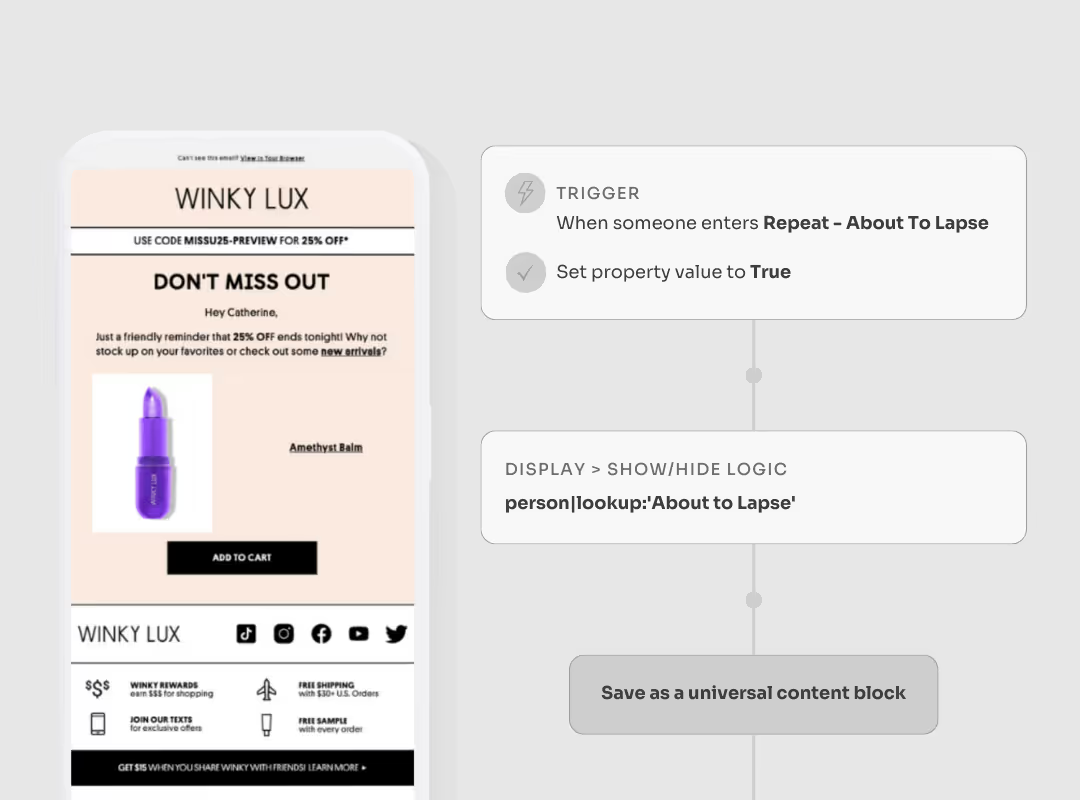
Reviews are the leading indicators of both customer satisfaction and future conversion rates. The rate at which BFCM customers leave reviews (and the sentiment of those reviews) tells you two critical things: whether you’re retaining the right customers, and whether you’re building assets that will drive Q1 acquisition.
Low review rates from BFCM customers often signal that you attracted deal-seekers rather than brand enthusiasts. Meanwhile, high-quality reviews from holiday shoppers become your most powerful Q1 marketing assets.
Detailed, thoughtful reviews with specific use cases and product benefits are strong indicators of future brand advocates. Customers who take the time to write comprehensive reviews (especially with photos or videos) demonstrate a level of engagement that typically translates to higher repeat purchase rates and word-of-mouth referrals
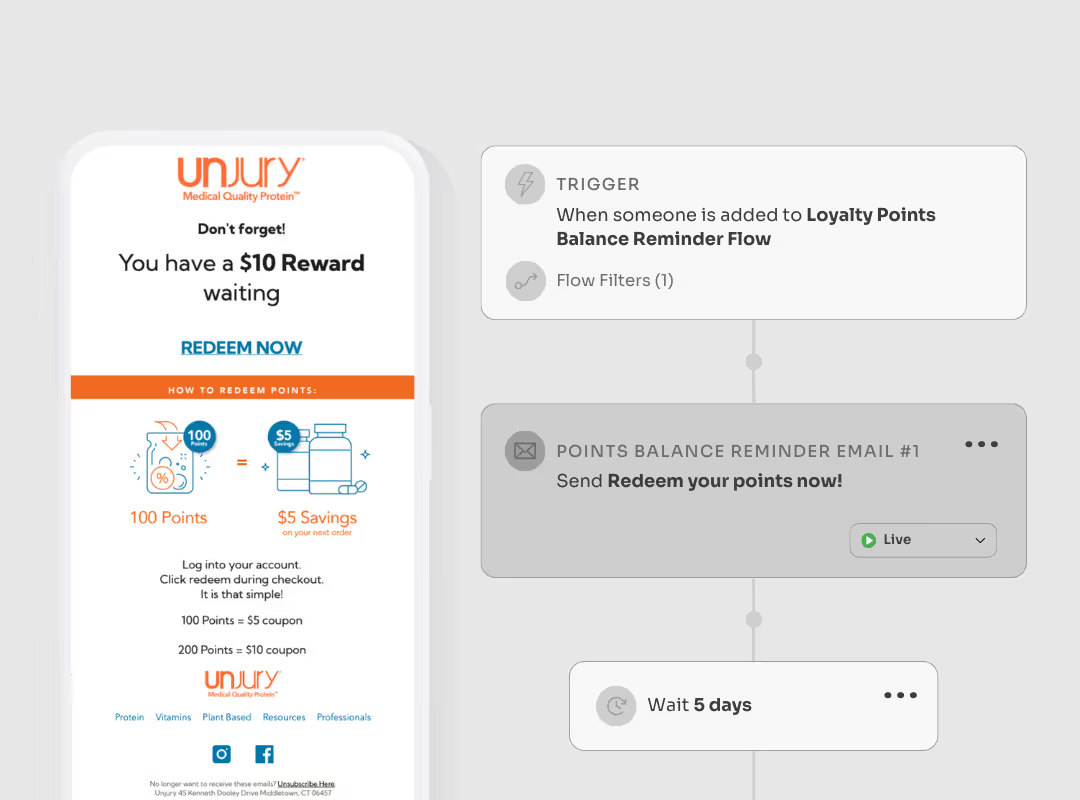
4. Loyalty Program Conversion and Engagement
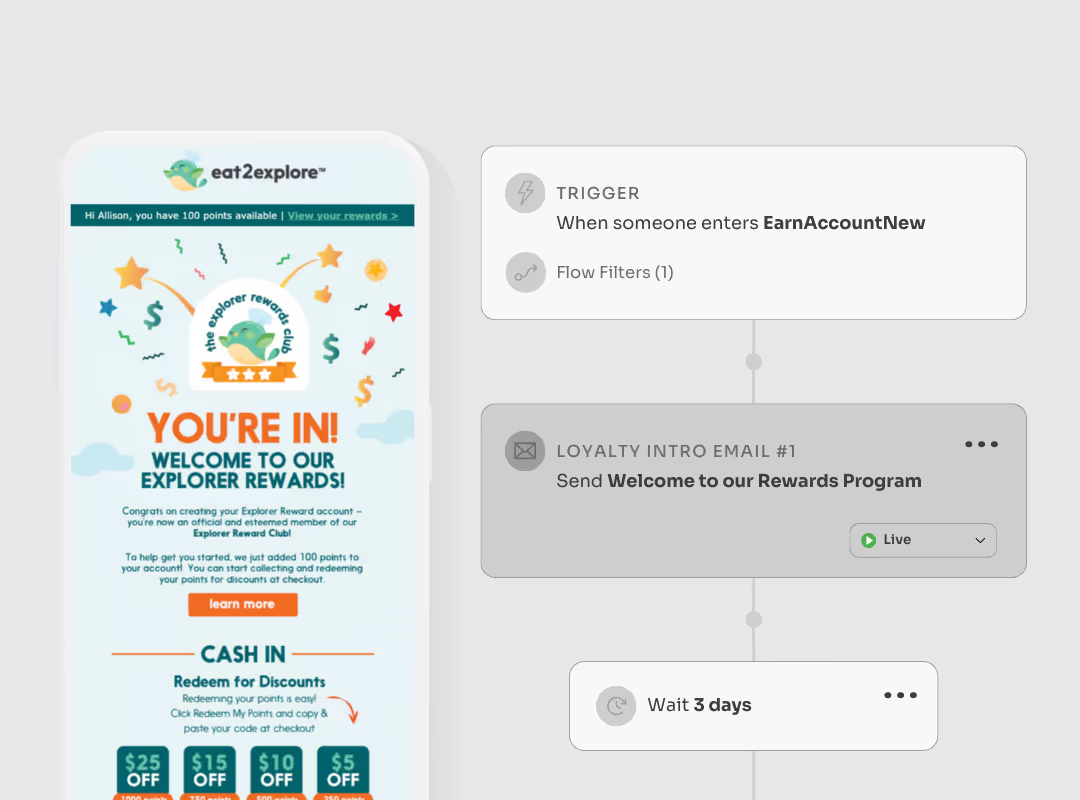
For brands with loyalty programs, BFCM is a massive enrollment opportunity. But enrollment alone means nothing. What matters is whether these new members activate: Are they redeeming points? Moving toward the next tier? Referring their friends?
Loyalty engagement in the first 30-60 days predicts not just repeat purchase rates, but also customer lifetime value. Active loyalty members typically spend 2-3x more annually than non-members.
5. Channel Health and Integration Quality
This one’s less obvious but equally important: How well are your retention channels actually working together? Are review requests being triggered at the right time based on shipping data? Are loyalty point balances showing up in your emails? Are win-back campaigns avoiding customers who just placed a second order?
Poor channel integration actively suppresses the retention metrics that drive Q1 revenue. You might have great individual tactics but poor overall results simply because your systems aren’t talking to each other.
The Critical Window Is Now
If you ran BFCM promotions, you’re currently sitting in the most important measurement window of the year. Your customers are:
- Deciding whether to leave reviews
- Evaluating whether to make second purchases
- Forming opinions about your brand based on post-purchase communications
- Either engaging with your loyalty program or ignoring it entirely
Every day that passes without measurement is a day you’re flying blind. You’re making Q1 decisions based on incomplete data, setting goals without understanding whether your holiday strategy actually worked.
Common Measurement Mistakes to Avoid
Even brands that recognize the importance of retention metrics often measure them incorrectly. Here are the pitfalls we see most often:
- Measuring too early: Checking retention metrics at the 7 or 14-day mark doesn’t give you meaningful data. The real picture emerges at 30-60 days post-purchase.
- Measuring without benchmarks: Knowing your repeat purchase rate is 15% means nothing without context. Is that good for your industry? Better or worse than last year? Higher or lower than your monthly average?
- Measuring without segmentation: Your BFCM cohort isn’t monolithic. First-time customers behave differently than repeat buyers. Gift purchasers have different patterns than self-purchasers. Aggregate metrics hide the insights you need.
- Measuring without action plans: The point of measurement is to identify gaps and opportunities. If you can’t connect a metric to a specific tactic or improvement, you’re just collecting vanity data.
What Good Measurement Looks Like
Brands that nail post-BFCM measurement share a few characteristics:
They measure systematically with documented processes, not ad-hoc Slack requests for data. They measure in context, comparing BFCM cohorts against historical benchmarks and industry standards. They measure to decide, using data to prioritize Q1 initiatives rather than justify past decisions. And they measure early enough to act, recognizing that by February it’s too late to fix December’s mistakes.
Most importantly, they understand that measurement without assessment is incomplete. You need a framework to interpret your metrics, identify gaps, and translate findings into action.
Your Next Step
The window for measuring BFCM performance is open right now, but it won’t stay open long. By late January, patterns are set and opportunities are missed.
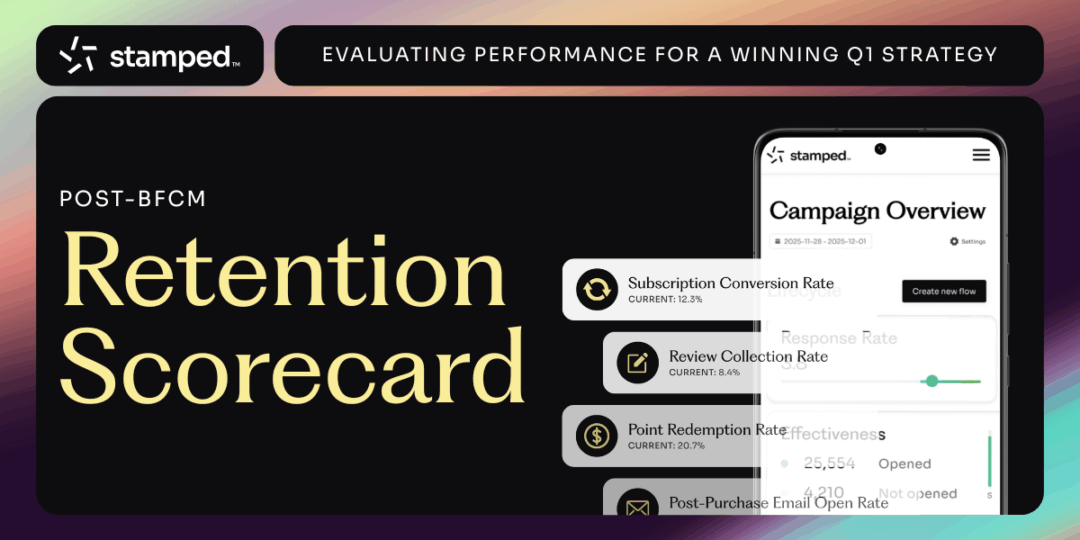
That’s why we created the Post-BFCM Retention Scorecard, a comprehensive self-assessment tool that helps you:
- Benchmark your performance against industry standards across all critical retention metrics
- Identify specific gaps in your lifecycle marketing, review collection, loyalty engagement, and channel integration
- Prioritize the highest-impact improvements for Q1
- Access tactical recommendations and AI-powered prompts for addressing what you find
The scorecard walks you through 50+ assessment questions across the five categories that matter most, giving you a clear picture of your retention maturity and exactly what to do next.
Don’t let another BFCM cohort slip away without understanding what actually worked.
Download the Post-BFCM Retention Scorecard and start building your Q1 strategy on actual data, not assumptions.